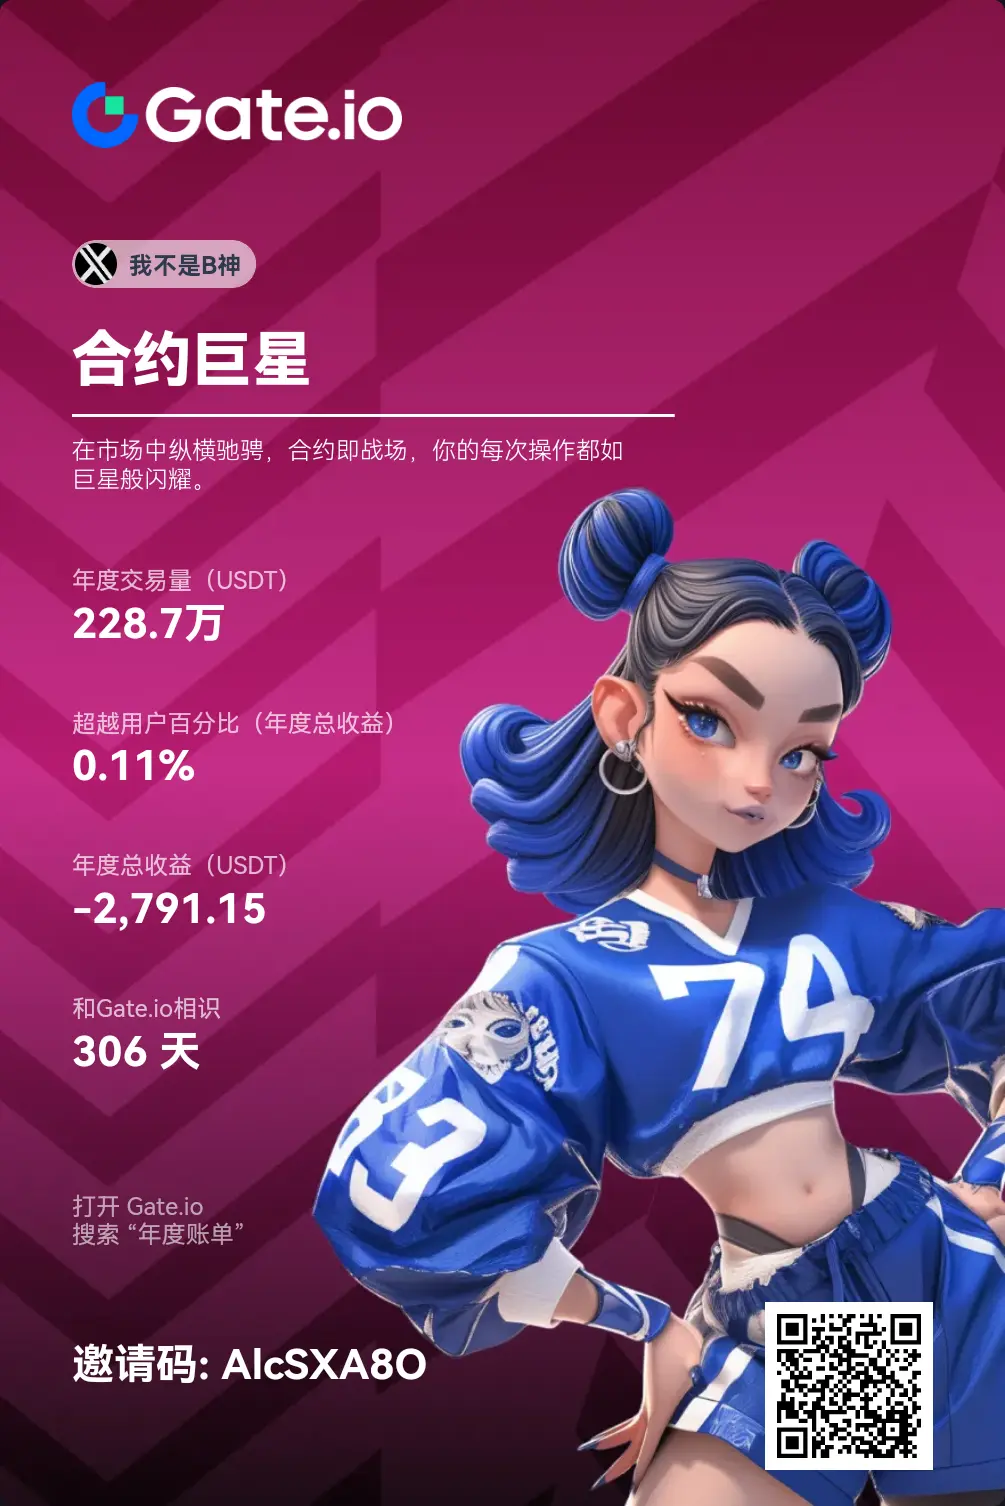
IAmNotBGod
#ETH# 【Price Trend Analysis】
1. Candlestick Patterns:
- Recently, after significant price fluctuations, a pullback has occurred, forming long upper and lower shadows, indicating market uncertainty.
- On the hourly chart, the price quickly surged from around the low of 1485 to over 1670, forming a strong rebound.
2. Technical Indicators:
- MACD: The current MACD histogram is showing red and gradually shortening, indicating that upward momentum is weakening, and it may enter a correction phase.
- RSI: The RSI value is approaching the overbought zone but has not sustained high levels, indica
ETH-2.52%

