- Topic1/3
6k Popularity
16k Popularity
10k Popularity
54k Popularity
20k Popularity
- Pin
- 📢 Gate Square #Creator Campaign Phase 2# is officially live!
Join the ZKWASM event series, share your insights, and win a share of 4,000 $ZKWASM!
As a pioneer in zk-based public chains, ZKWASM is now being prominently promoted on the Gate platform!
Three major campaigns are launching simultaneously: Launchpool subscription, CandyDrop airdrop, and Alpha exclusive trading — don’t miss out!
🎨 Campaign 1: Post on Gate Square and win content rewards
📅 Time: July 25, 22:00 – July 29, 22:00 (UTC+8)
📌 How to participate:
Post original content (at least 100 words) on Gate Square related to
- 📢 Gate Square #MBG Posting Challenge# is Live— Post for MBG Rewards!
Want a share of 1,000 MBG? Get involved now—show your insights and real participation to become an MBG promoter!
💰 20 top posts will each win 50 MBG!
How to Participate:
1️⃣ Research the MBG project
Share your in-depth views on MBG’s fundamentals, community governance, development goals, and tokenomics, etc.
2️⃣ Join and share your real experience
Take part in MBG activities (CandyDrop, Launchpool, or spot trading), and post your screenshots, earnings, or step-by-step tutorials. Content can include profits, beginner-friendl
- 🎉 Gate Square’s "Spark Program" Surpasses 1,000 KOLs!
💥 The creator ecosystem is in full bloom!
📈 Get featured, earn rewards, and grow your influence—what are you waiting for?
💰 Cash incentives ✔️
🚀 Traffic support ✔️
👑 Exclusive verification ✔️
From 0 to 1,000 in just weeks—Gate Square is becoming the epicenter of Web3 content! ⚡
You’re not just posting content, but the next "viral opportunity"!
🌟 Join the Spark Program and kickstart your breakthrough!
👉 https://www.gate.com/announcements/article/45695
- 📢 #Gate Square Writing Contest Phase 3# is officially kicks off!
🎮 This round focuses on: Yooldo Games (ESPORTS)
✍️ Share your unique insights and join promotional interactions. To be eligible for any reward, you must also participate in Gate’s Phase 286 Launchpool, CandyDrop, or Alpha activities!
💡 Content creation + airdrop participation = double points. You could be the grand prize winner!
💰Total prize pool: 4,464 $ESPORTS
🏆 First Prize (1 winner): 964 tokens
🥈 Second Prize (5 winners): 400 tokens each
🥉 Third Prize (10 winners): 150 tokens each
🚀 How to participate:
1️⃣ Publish an
- 📢 Gate Square #TopContentChallenge# is coming! Post high-quality content and win exclusive rewards!
🌟 We will select outstanding posts for exposure, and help elevate your influence!
💡 How to Participate?
1.Add the #TopContentChallenge# tag to your post.
2.Posts must be over 60 characters and receive at least 3 interactions (Likes/Comment/Share).
3.Post may include only the #TopContentChallenge# tag.
🎁 We’ll select 1 top post to win $50 Futures Voucher every Tuesday and Thursday!
📃 High-quality posts will be shared on Gate Square and labeled as [Featured Posts]!
📌 Rewards will be distribu
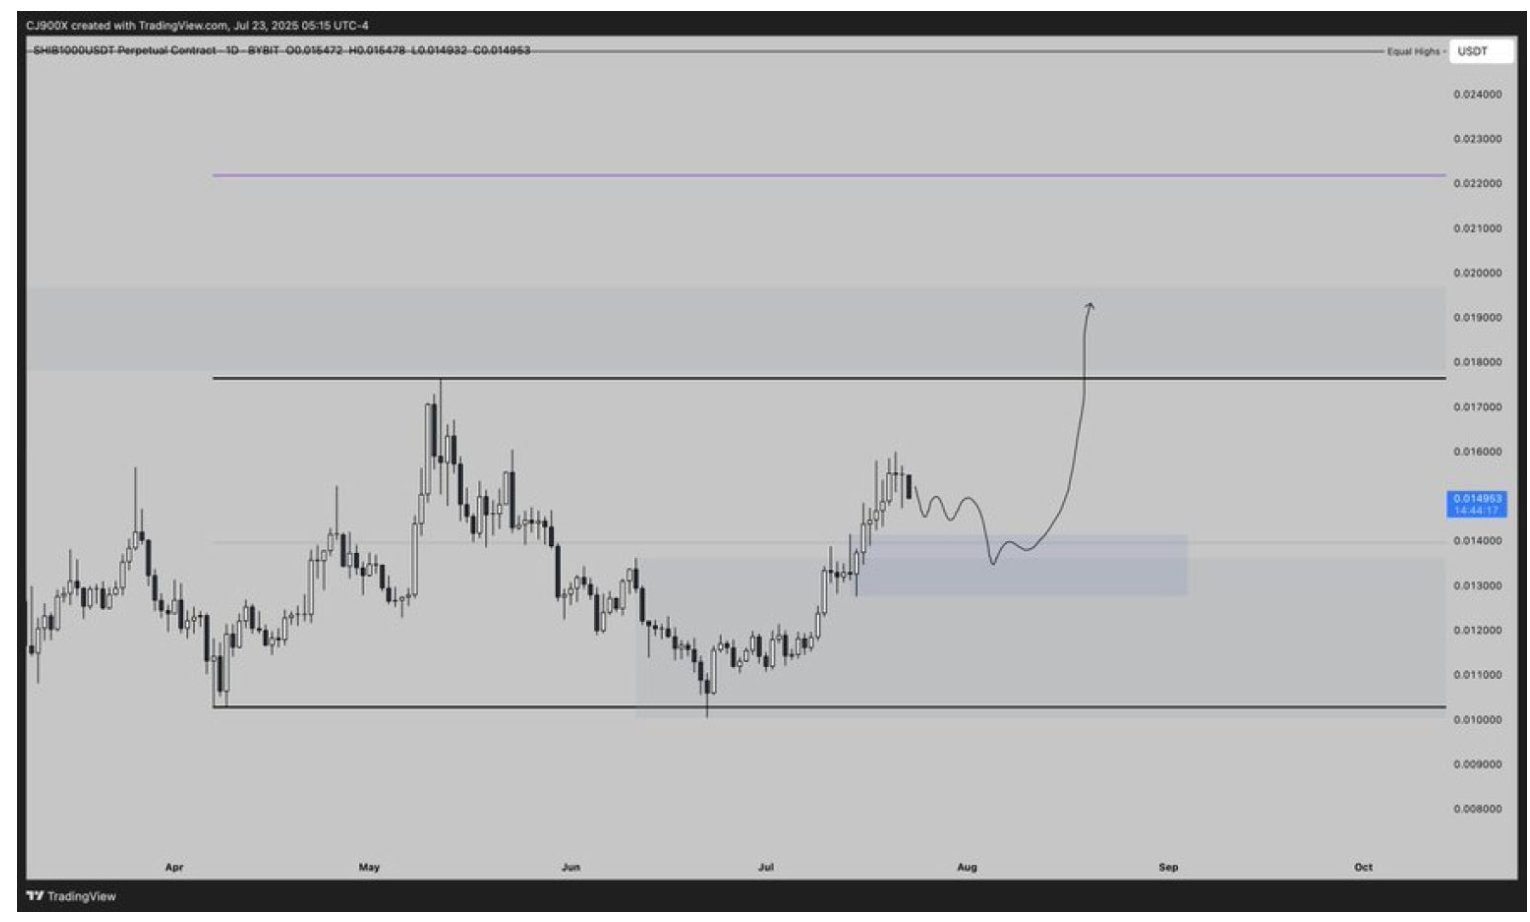
Shiba Inu (SHIB) Price Prediction: Analysts Warn of 0.0000128 USD long positions Defense Line with Potential Rebound Space Exceeding 34%
Shiba Inu(SHIB)has fallen 11% to $0.000013483 in the past 24 hours, but well-known analyst CJ points out that it has currently entered the "middle band demand zone"(0.0000142-0.0000128), which may present an excellent opportunity for long positions. The technical aspect shows that SHIB has been oscillating in the trading range of $0.00001004-$0.00001764 for nearly five months, and it has currently retreated to the middle band of the range. If it holds the support at $0.0000128, it is expected to initiate a rebound towards the upper band of $0.00001764, with a breakthrough aiming at a target of $0.0000190 (+34%). The on-chain chip distribution suggests higher targets of $0.000024-$0.000035.
Key support area: last line of defense for long positions
The trading range oscillation pattern: has not broken for five months
Rebound Path and Target Calculation
** **
**
Operation Strategies and Risk Control Points
on-chain data verification
Conclusion: SHIB has currently fallen to the middle band of a five-month trading range, with both technical indicators and on-chain data indicating strong support in the $0.0000142-$0.0000128 region. Analyst CJ's "demand zone" theory requires two main conditions: 1) it must not fall below $0.0000128; 2) the rebound must break through the $0.0000150 mid-axis pressure with volume. If the pattern is established, the first target is $0.00001764 (+27%), and if it breaks through, we look at $0.000019 (+34%). Given the characteristics of meme coins, investors must strictly adhere to the stop-loss line at $0.0000128 to guard against the risk of falling to the $0.00001004 bottom of the trading range after a breakdown.