- Topic1/3
56k Popularity
15k Popularity
46k Popularity
2k Popularity
2k Popularity
- Pin
- #Gate 2025 Semi-Year Community Gala# voting is in progress! 🔥
Gate Square TOP 40 Creator Leaderboard is out
🙌 Vote to support your favorite creators: www.gate.com/activities/community-vote
Earn Votes by completing daily [Square] tasks. 30 delivered Votes = 1 lucky draw chance!
🎁 Win prizes like iPhone 16 Pro Max, Golden Bull Sculpture, Futures Voucher, and hot tokens.
The more you support, the higher your chances!
Vote to support creators now and win big!
https://www.gate.com/announcements/article/45974
- 🎉 Hey Gate Square friends! Non-stop perks and endless excitement—our hottest posting reward events are ongoing now! The more you post, the more you win. Don’t miss your exclusive goodies! 🚀
1️⃣ #ETH Hits 4800# | Market Analysis & Prediction: Boldly share your ETH predictions to showcase your insights! 10 lucky users will split a 0.1 ETH prize!
Details 👉 https://www.gate.com/post/status/12322612
2️⃣ #Creator Campaign Phase 2# |ZKWASM Topic: Share original content about ZKWASM or its trading activity on X or Gate Square to win a share of 4,000 ZKWASM!
Details 👉 https://www.gate.com/post/st - 📢 Gate Square #Creator Campaign Phase 2# is officially live!
Join the ZKWASM event series, share your insights, and win a share of 4,000 $ZKWASM!
As a pioneer in zk-based public chains, ZKWASM is now being prominently promoted on the Gate platform!
Three major campaigns are launching simultaneously: Launchpool subscription, CandyDrop airdrop, and Alpha exclusive trading — don’t miss out!
🎨 Campaign 1: Post on Gate Square and win content rewards
📅 Time: July 25, 22:00 – July 29, 22:00 (UTC+8)
📌 How to participate:
Post original content (at least 100 words) on Gate Square related to
Bitcoin to peak at $155,000 on this date, according expert
As Bitcoin (BTC) flirts with reclaiming the $120,000 mark, a trading expert has suggested the asset has more momentum left, potentially propelling it to a record high of $155,000.
This outlook is supported by insights from Bitcoin’s weekly chart, which point to a strong rally that began after BTC rebounded from the 50-week Moving Average (MA) on April 7, 2025, according to Analysis by TradingShot in a TradingView post published July 28.
AnalysisTradingShot TradingView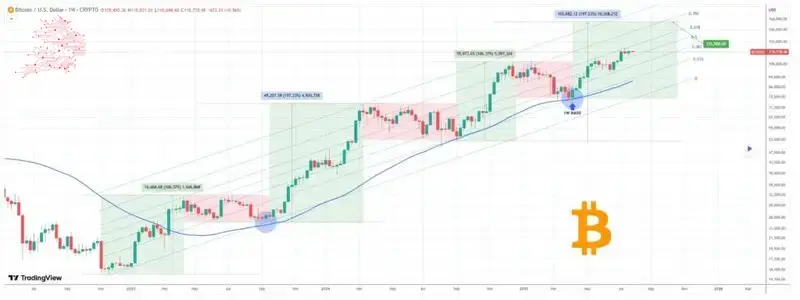 Bitcoin price analysis chart. Source: TradingView
![]() Bitcoin price analysis chart. Source: TradingView**Bitcoin price analysis chart. Source: TradingViewThe rebound occurred within a broader three-year ascending channel that began in November 2022. Notably, this was the second time Bitcoin found support at the 0.236 Fibonacci level within this structure, an area historically tied to major bullish reversals.
Bitcoin price analysis chart. Source: TradingView**Bitcoin price analysis chart. Source: TradingViewThe rebound occurred within a broader three-year ascending channel that began in November 2022. Notably, this was the second time Bitcoin found support at the 0.236 Fibonacci level within this structure, an area historically tied to major bullish reversals.
The current setup also mirrors earlier price movements. In late 2022 and again in early 2023, Bitcoin surged approximately 106.37% following similar technical signals. A more aggressive rally between late 2023 and early 2024 resulted in a 197.23% gain.
TradingShot now suggests that the current expansion phase echoes that stronger move, implying a potential peak near $155,500 in the coming months. This would represent an upside of about 30% from current levels.
TradingShot## BTC facing resistance
In a July 28 X post, cryptocurrency trading expert Michaël van de Poppe noted that Bitcoin has once again stalled at a key resistance zone around $119,400, facing rejection after a brief push higher in the short term.
Additionally, the price action has created a liquidity cluster below, increasing the probability of a downward sweep before any continuation. Therefore, a correction into the $116,500 and $117,500 range could present a strong accumulation opportunity.
Bitcoin price analysis
At the time of reporting, Bitcoin was trading at $118,961, representing a 0.7% increase over the last 24 hours. On the weekly chart, it has posted a modest 0.68% gain.
Meanwhile, the 14-day Relative Strength Index (RSI) sits at 64.11, indicating solid buying momentum without entering overbought territory, suggesting room for further gains.
Featured image via Shutterstock
Featured image via Shutterstock Featured image via Shutterstock