YALA Token Price in Flux: A DeFi Newcomer Facing Early Tests
Recent YALA Token Price Performance Overview
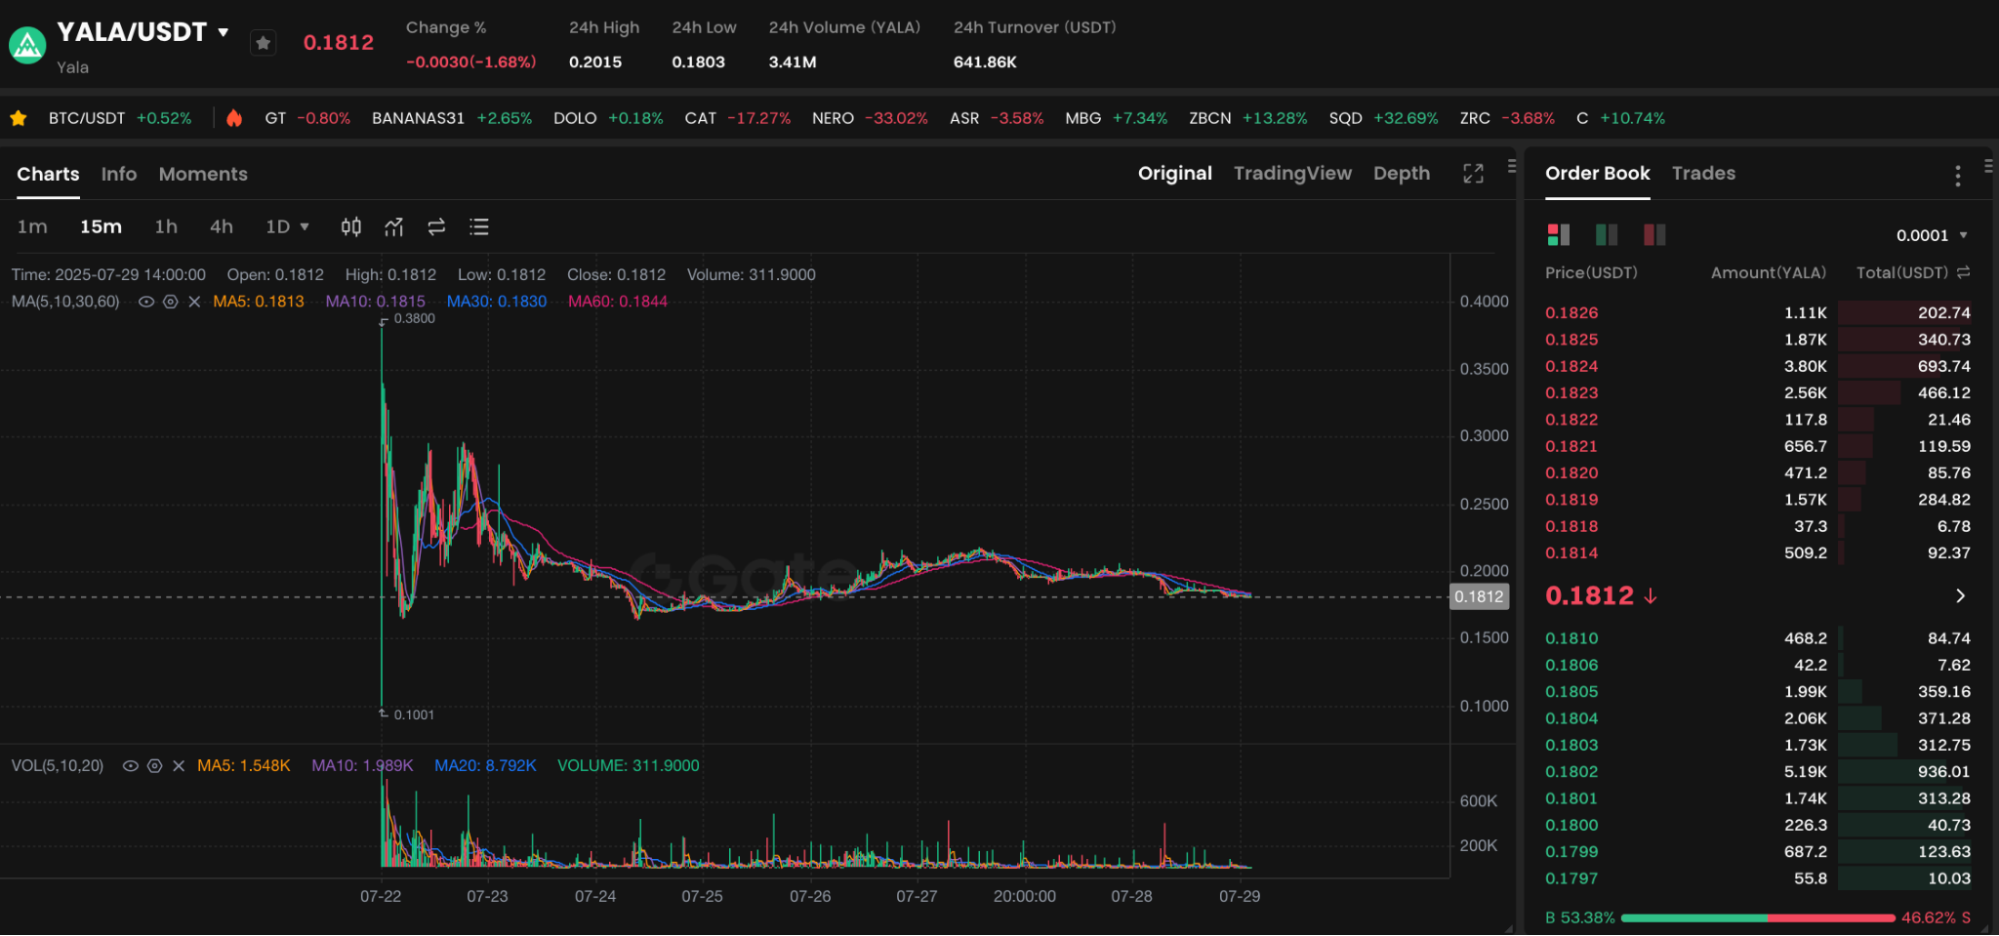
Chart: https://www.gate.com/trade/YALA_USDT
As of July 29, 2025, YALA/USDT trades at $0.1812, reflecting a 24-hour decline of 1.68%. Over the past seven days, YALA briefly spiked to $0.38 before pulling back. It is now consolidating in the $0.18 range.
This downward move shows the short-term exit of speculative capital, a typical feature of initial price corrections in high-volatility crypto projects. The chart also reveals that trading volume has gradually contracted, indicating an emerging balance between buyers and sellers.
Market Psychology Driving High Volatility
Since launching in mid-July, YALA has rapidly attracted significant capital inflows. However, with its DeFi platform still in the early stages of development, some investors have realized profits, triggering a price retracement of over 50% from its peak. Such patterns are common among early-stage DeFi projects where market sentiment swings sharply. This is driven in part by speculative expectations and in part by investors’ still-uncertain confidence in the project’s real-world application.
Project Fundamentals: Is YALA Worth Long-Term Consideration?
From a fundamentals standpoint, YALA is a modular native asset liquidity protocol specifically designed for Bitcoin, aiming to solve BTC’s participation barriers in DeFi. Its core components include:
- The $YU native BTC-collateralized asset;
- Cross-chain atomic swap mechanism;
- An insurance model inspired by Islamic finance’s Takaful system;
- A multi-layer modular architecture that supports multi-chain expansion.
These innovations not only enhance protocol security but also deliver more practical financial tools for BTC. This indicates that YALA is positioned as more than a short-term speculative play. Its long-term prospects warrant attention.
Highlights of YALA Tokenomics
Within the YALA protocol, the YALA token serves several key purposes:
- Payment of on-chain gas fees;
- Staking YALA as collateral for the insurance mechanism;
- Participation in DAO governance;
- Incentivizing early liquidity providers and prover nodes.
As new protocol features go live, demand for YALA is expected to rise and price volatility may subside. The team’s commitment to a steady token unlocking schedule may help mitigate early large-scale sell-offs.
Risk Disclaimer
While YALA’s current token price is relatively low, the project’s long-term narrative and clear market positioning stand out. Nevertheless, as with any new venture, risks remain—chiefly:
- Delays in technology development and deployment;
- High market volatility and still-limited liquidity;
- Governance mechanisms not yet fully implemented.
Investors interested in participating should consider starting with a modest allocation. They should closely monitor updates from the project’s official website and GitHub, and use charts to identify key support (e.g., $0.18) and psychological resistance (e.g., $0.22) levels.
Related articles

Pi Coin Transaction Guide: How to Transfer to Gate.io

What is N2: An AI-Driven Layer 2 Solution

Grok AI, GrokCoin & Grok: the Hype and Reality

How to Sell Pi Coin: A Beginner's Guide

Crypto Trends in 2025
